Friday, April 18, 2014

Rao’s and Uncommon Grounds – Location Model

Rao’s and Uncommon Grounds – Location Model
By Liz, Paula, and Weiding

Oligopoly refers to market with a small number of firms. Each firms behavior is interdependent of the others meaning one firms choices affect the other firms choices. Consider Coke and Pepsi, the price Pepsi charges affects not only their sales but the sales of coke as well. Game theory analyses the strategic behavior of firms whose choices are interdependent. Each game has a player (firms), strategy (the choice the players have e.g. where I should locate the firm) and payoffs (what the player obtains as a result of playing the game). Below is an illustration of location model between Rao’s and Uncommon Grounds.
 Both Rao’s and Uncommon Grounds sell beverages, cookies and cakes .The differences between them are the quality of their products and their locations. Rao’s is located in the library while Uncommon Grounds is in Blanchard and Uncommon Grounds has higher quality of goods. Rao’s attracts students who like to study in the library and who live near the building. Those students are willing to give up the pleasure that they can get from Uncommon Grounds’ more delicious milkshakes, smoothies cupcakes for the convenience of a closer location. They choose to go to Rao’s because they value their time more than food or drink and don’t want to waste it on transportation. The same conclusion applies to Uncommon Grounds. 
            In a case where the two firms are differed only by locations, as we covered in class, the two firms will move toward the middle, as they are able to have more customers and increase their market share as well as their profits.  But in this case where two cafes are also differed by quality of foods, this model is distorted.
            Suppose Rao’s moves to a location closer to the Blanchard, let’s say, in the common room of Brigham. Then, Rao’s is supposed to attract some customers who previously went to Uncommon Grounds e.g. students who live in Brigham are more likely to go to Rao’s. However, as the locations of two cafés are much closer, people who used to consume at Rao’s may have second thoughts because Uncommon Grounds obviously has more delicious foods. Therefore, people will make their choices based on their preferences. Those who live close to Rao’s and value time more will still consume at Rao’s while those who value tasty foods more will go to Uncommon Grounds instead even though it is farther from them. Since people have different preferences, it is hard to calculate whether changing the location will attract more consumers or not. Therefore, it is not likely for Rao’s to move toward the middle.
            The same analysis can apply to the case of Uncommon Grounds’ change of location. On the contrary though, the conclusion is different. If Uncommon Grounds moves closer to the library, because it has higher quality of foods, it is able to attract customers from Rao’s. So Uncommon Grounds has the incentive to move closer to Rao’s!


Monday, April 14, 2014

HOW DO WE GET THAT EXPENSIVE TEXTBOOK?


HOW DO WE GET THAT EXPENSIVE TEXTBOOK?
by Jackie, Shijia, Van, Yixuan
            Life is never easy for a college student, isn’t it?
            When approaching the time for thorough packing at the end of the semester, we will find the most troublesome stuff is BOOK. Staring at these textbooks, do you recall the scene of hesitating in Odyssey? After careful comparison with copies online, we still walked away because of the ridiculously un-affordable price.
            Why are textbooks so expensive? Even though it does not cost hugely to enter the publishing industry and the U.S. has antitrust laws, a relatively small number of powerful publishers are still perceived to have monopoly power over textbook pricing. When our professors decide the materials for their courses, they will place orders at prospective bookstores, in our case the Odyssey. Odyssey will then contact publishers to notify them what books to order. Once the deal is set, the retailer like the Odyssey has the right to increase the price of each copy a little bit for its own profits. Unfortunately, if our professors happen to choose books whose copyrights owned by certain publishers, then it is quite usual for us to spend over $200 for the latest edition of a hard cover, colored, used textbooks. Sadly, since publishers only make money when new books are sold, they also buy up the old books and force the used book market to raise price, which makes used books less appealing to students.
            In this case, some of us tend to seek for digital forms of textbooks instead. This option generally costs less and is suitable for students’ tiny budgets. Not surprisingly, as we can see, Amazon dominates vast marketplace of e-book retailing and provides with only kindle edition to limit the use of resources. Compared to physical books, e-books are more accessible. You can read e-books on multiple devices such as PCs in the library, your MacBook, or even the smartphones that you carry everywhere. However, e-books also bring about inconvenience that keeps majority readers from using, such as difficulty in looking up specific part of the book, distraction from redundant features like embedded quizzes and electronic flashcards. You will find another disadvantage of e-books when you read through this blog.
            Luckily, we can go to our beloved library and borrow a hard copy of textbook for free. From the economics we learned, we know that each decision has an opportunity cost. Most textbooks are on reserve and each student can only borrow one at a time for three hours. We need to well plan this limited time period and use the book to the fullest. Don’t be too optimistic! You are risking not getting the book and re-plan your time, because someone might have already checked it out! Well, “If only I had bought my own book!”
            After the semester is done, you are offered several ways to sell back your books. Odyssey only buys back books that have been ordered from professors for the new semester at no more than half of the original price. You can try bigger marketplace like Amazon.com, Half.ebay.com, Textbookrush.com, where you will find a pool of potential buyers. Compared to Odyssey, in the latter option, you will see listed prices of different sellers and then set your own price. It sounds like perfect competitive market where you have perfect information, competitors perceive same prices as you do, and it is easy to enter and exit. Faced with this elastic demand, however, you may realize that the older edition that you possess, the less likely you are able to sell it back. Besides, you wouldn’t be able to sell if it is an e-book! Rationally speaking, you want to adjust your preference for purchasing textbook next time by thinking of how will you be better off. As a supplier, your cost is the original price you paid, the depreciation of the book, the transaction fee charged by Amazon, and the shipping fee you paid. You need to balance the original price you pay for and the chance of getting potential return.
            In a nutshell, we are facing unaffordable prices for textbooks. Many of students still prefer using physical books. We cannot change the fact that we need books to do homework, which contributes to a fairly inelastic demand for textbooks. Thus, we do wish that the textbooks could be less expensive. We hope there would be more open source. However, it seems that the price adjustment won’t come soon, so why don’t we think about it in a more optimistic way: The cost we pay for books will gradually pay off and become our very own intangible asset, something called “Knowledge”.


Friday, April 11, 2014

Apple as a monopolistic industry


Apple as a monopolistic industry
Yixi, Gabriela, Jessica, and Tahlia

A monopoly is a market structure involving only one firm that sets both price and quantity and has a downward sloping demand curve. The graph below shows that the quantity in a monopoly is at MC=MR. It would be maximizing for Y. The price is the demand curve. The consumer surplus is located below the demand curve above the price. The producer surplus, is found between the price and marginal cost.


The first Apple ipad was released in 2010 and, at the time, dominated the hand held tablet industry. According to an ABI Research report, the ipad held 85 percent market share. For the purposes of this example, we will assume Apple is still a monopoly. What does this exactly mean? Apple has no other competitors, they created a product without substitutes and therefore face no competition. Because of this they set the price and quantity of their product regardless of the market equilibrium (as mentioned in class they now are the market). Quantity is lower than that of a perfect competition scenario and profits are much greater as well. More details on the price effects are explained below. Monopoly power is regulated in the United States by antitrust laws which promote fair competition. On the other hand, patents give a firm the right to produce an exclusive design of the product, for example. This means that, at least for some time, the firm is the only one who is able to produce and sell the exact product for which it was given a patent. This is done as an incentive for innovation and change.
By creating the new category of device, iPad dominated the tablet industry. Apple as a monopolist had the power over setting the market price of iPad. Recall the quantity effect and price effect in influencing Apple’s decision in setting the price. Aiming at attracting more potential consumers to its first generation iPad, which was innovative and advancing, Apple set the price of base model at $499, which was much lower than the pre-release estimates by Wall Street analysts. Therefore, Apple sold more than 15 million first-generation iPads before its release of the iPad 2. As price decreases on all iPad that Apple sell, the marginal revenue of iPad 1 is less than the slope of consumers’ demand curve. However, since Apple was acting as a monopoly in selling iPad, the market price is still much higher than the one in a perfectly competitive market.

**How apple uses price discrimination to increase their revenue.

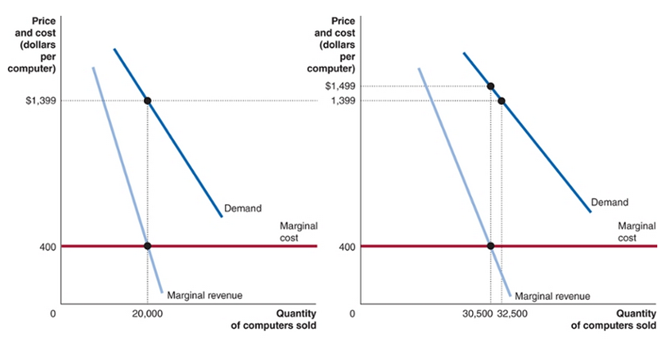
During the fall of 2011, Apple introduced and sold their MacBook Pro laptop computers with 13-inch screen on its website and in its retail stores for $1, 499. Yet, college students and faculty members could buy the same computer from Apple for $1,399. Why would Apple charge different prices for the same computer, depending on whether the buyer is an customer that studies in an educational institution? It makes sense for Apple to charge different prices because students that are customers have a different price elasticity of demand than other customers. So, Apple will charge the market segment with the less elastic demand a higher price and the market segment with the higher elastic demand a lower price. This suggests that Apple charges customers a lower price because they have a more elastic demand than some customers.


Here, the graph shows that in the education customers segment of the market, the marginal revenue equals marginal cost at 20,000 computers sold. This shows, Apple should charge a price of $1,399 to maximize their profits. Yet, if Apple charges $1,399 to the general public segment of the market, shown in (b) then it will sell 32,500 computers which is more than the profit-maximizing quantity. By charging $1,499 to the general public, Apple will sell 30,500 computers, which is the profit-maximizing quantity. We have shown that Apple will maximize their profits by charging students in educational institutions with a lower price than it charges the general public. You would notice the demand curve in graph (a) that is more elastic and steeper.

Math example :)

Apple wants to maximize its profits. An output and price must be found that allows the company to make as much as it can. The profit maximization function is given for a monopoly:
    Max y, P(y)*y - C(y)

As an example (not using actual data) let us say that Apple has a demand curve of P=400-3yand a total cost function of C(y)=y2+ 4

In order to find optimal output we must use the profit maximization equation.
Max y, (400-3y)*y - y^2- 4
Here we use First Order Conditions and solve for y
400-8y=0
y=50

Now that we have found y, we plug it into the demand curve to find the price
p=400-3(50)
p=250

Lastly, we want to know the profits that this monopoly will receive. Here we plug our newly found quantity and price into the profit equation
profit =(50)(250) - (50)2-4
profit = 10,004

This is how one would calculate the profit of a monopoly.

Resources:


http://www.law.cornell.edu/wex/patent

Sunny Island Coffee: A Mount Holyoke Coffee Supplier

Sunny Island Coffee: A Mount Holyoke Coffee Supplier
By Dorothy, Kate, Niole, Thu

Sunny Island Coffee is the main supplier of coffee beans to Mount Holyoke College. The school recently had to reevaluate Sunny Island’s ability to fulfill the school’s demand for coffee in light of bad weather affecting coffee bean crops. In 2012, the plantation became a victim of flood damage. In years previous, Sunny Island Coffee broke even in terms of their net profit. The equilibrium price in the coffee market was p = $8per lb. In 2012, the Island’s crops were severely damaged. The firm decided to prevent further issues by investing in a drainage system, but they will have to incur the cost of laborers to maintain this system which they considered a variable cost.
This has also increased the cost of running the plantation. The cost per lb of coffee produced became: C(y)=,y-2.+5y. The supply function looked like this: p=2y+5

Mount Holyoke College’s Economist decided to investigate further and found the the profit equation,π=py-5y-,y-2.=8y-5y-,y-2..
As P=8, ATC=y+5, the firm can easily produce the right amount of coffee so that P>AVC (8>y+5, 3>y) and make profits. Therefore the firm can continue to produce in the short run.
For now, because Sunny Island Coffee is able to continue production in the short run, Mount Holyoke College decided to continue giving Sunny Island their business. But will need to evaluate other options, as it is unclear whether or not they will be able to continue business in the long run. However, as we all know, Mount Holyoke students need their coffee, and Sunny Island is able to produce it.


Monday, April 7, 2014

How Elasticity Affects the Pricing of Coffee in Mount Holyoke College

How Elasticity Affects the Pricing of Coffee in Mount Holyoke College
by An, Maame, Mariah, and Meher

Caffeine to get started in the morning, a bit more mid-morning to make it through that class before lunch, another cup for that mid-afternoon class during which food comas kick in, yet some more when the realization sets in that it is going to be a late night due to work. When walking around any university or college campus, coffee is the staple that can be seen in many students hand at pretty much any time of day. Easily half if not more of the student population at Mount Holyoke College are coffee drinkers. Many of them are addicted to the caffeine and have it at least once a day if not more often. However, coffee is an expensive habit to keep up while in college. Whether students own their own brewer, or buy cups of it from the cafes around campus, or go into South Hadley and surrounding towns to grab a cup from local and chain coffee shops, the costs of all those cups throughout the semester really accumulate. So why do students keep drinking so much coffee?

Price elasticity is defined to be “the percent change in quantity divided by the percent change in price.” It is the responsiveness of customers’ demand to the change in price, in this case, specifically, students’ choice of buying coffee when its price changes. Inelasticity is the case when the percentage change in quantity is less than the change in price. To many students in Mt. Holyoke College, their demand for coffee is inelastic, that means if the price of coffee rises, students will still choose to buy coffee. Then why is the demand for coffee of Mt. Holyoke students inelastic? Let’s take into account three groups of students. Students from the first groups take 5 academic classes this semester, not to mention a physical education class. Therefore they usually drop by Rao’s to  buy a cup of coffee before staying up until 2pm in the library writing essays, doing homework or finishing lab assignments. The second groups of students are very energetic. They participate in varsity teams such as crew team, swimming team, etc. They usually have to get up at 5 or 6 in the morning everyday to drill. Right after that, they may just purchase some coffee from Uncommon Ground on their way to classes to keep them awake for the whole day. For the third group, they are coffee lovers; thus, they usually take a to-go cup of coffee from the dining hall every time they go for their meals. For such a great demand of coffee around campus, even if the price rises, students are willing to pay higher for a cup of coffee when they need, which leads to inelasticity.

Now within this small consumer base, there are options from where to purchase coffee, namely Uncommon Grounds, Raos and Thirsty Mind (the caveat being that dining hall coffee doesn’t really count since it is often lukewarm and weak). For someone who really doesn’t have a preference between these places but often chooses Raos before heading to the library, sees the coffees as perfect substitutes. This will mean that if Rao’s decides to increase the price of their coffee by even 50 cents, all the students who consider Uncommon Grounds or Thirsty Mind as equally good, will shift to consuming coffee from those places instead. This means that the PED of Rao’s coffee for those people is infinite.
Another way to look at this is through the Cross Elasticity model. If the price of Raos coffee goes up, the quantity demanded of Uncommon Grounds coffee will increase as well. This will be reflected by a CED value > 0. On the other hand, if the price of luna bars available at Rao’s (an energy bar many students enjoy alongside a coffee), decreases, many students may feel compelled to get a coffee from Raos to go with their Luna bar. These two substitute and complement relationships are shown in the CED graph below:
Therefore, we can conclude that price elasticity of demand, as well as the Cross price elasticity of demand is what all firms producing coffee at this college would find useful to consider.